Although discretionary outperformance is nothing new, systematic managed futures/CTAs are struggling to adjust to the volatile economic backdrop that COVID-19 has created
Although discretionary outperformance is nothing new, systematic managed futures/CTAs are struggling to adjust to the volatile economic backdrop that COVID-19 has created
As technology continues to evolve, the investment industry has increasingly turned to algorithms to analyze data and make split-second trading decisions. But how useful are algorithms in systematic trading? By leveraging Preqin Pro’s benchmark return data, we provide a direct comparison of CTA performance by trading strategy. And by putting the results into context within the overall hedge fund and public equity markets, we compare their value in an investment portfolio.
How the Trading Strategies Differ
Many CTAs have evolved from simply trading commodity futures to looking increasingly like global macro funds. While CTAs started out trading in commodity markets, many now trade global (managed) futures and options across several asset classes, including interest rates, currencies, stock indices, and commodities. The difference in trading strategy largely boils down to discretionary and systematic.
Discretionary trading relies more on the decision-making process of human traders, but does lean on computer programs for certain prerequisites to trading such as data analysis and signal generation. On the other hand, systematic trading relies on algorithms designed to execute trades with a set of programmable rules based on market indicators. The strategies complement each other in a portfolio through integrating uncorrelated returns, as discretionary trading tends to be more fundamental based and systematic tends to be more technical, or momentum driven.
Discretionary vs. Systematic Performance
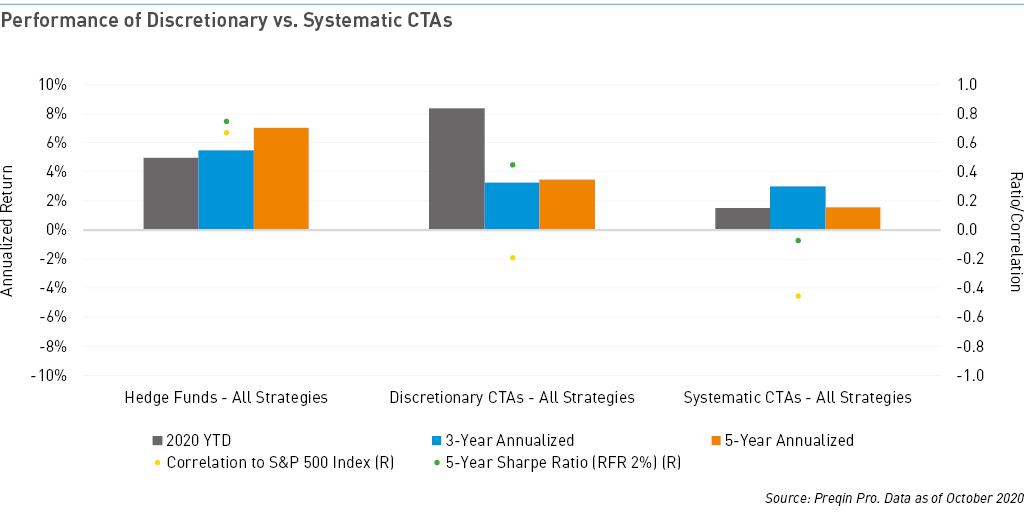
As shown in the chart above, CTAs employing discretionary trading strategies have outperformed their systematic trading peers by providing better 2020 YTD, three-year, and five-year annualized returns, along with higher risk-adjusted returns as defined by the Sharpe ratio. Discretionary CTAs have even outperformed hedge funds so far this year, according to the Preqin All-Strategies Hedge Fund benchmark. Systematic CTAs have lagged discretionary strategies on a five-year annualized return basis by 1.92 percentage points, and on a three-year basis by 0.26 percentage points, but fall substantially behind YTD by 6.86 percentage points.
Why the Sizable Difference in 2020?
Given the unprecedented nature of the events in 2020, many trends and patterns that existed in securities markets have broken down. While markets remain in a state of dislocation, it becomes more difficult for algorithms that rely on historical price and volume patterns to spot new trends to follow. Furthermore, algorithms that seek to identify overbought and oversold securities in anticipation of mean reversion can often find themselves on the wrong side of the trade in extreme market conditions, and may have to stop-loss their positions. Either way, this means that trading opportunities for systematic funds can be scarce at times of market stress, which may help explain the lower performance compared to funds that rely more on discretionary management.
Systematic strategies heavily rely on price momentum to drive returns. Momentum tends to build consistently yet slowly in periods of low volatility, but can drop in periods of high volatility. Financial markets have been characterized in 2020 by spikes in and sustained, higher-than-average levels of volatility. The VIX is used to gauge equity market volatility, but CTAs in aggregate are arguably more exposed to commodities. Commodity risk, as defined by the standard deviation of prices of the S&P GSCI index have increased over the past 10 years, from a 10-year annualized rate of 21.23% to 26.85% over three years.
Why Invest in a Systematically Driven CTA?
Although systematic trading strategy returns lag discretionary returns, the appeal of systematic trading is as a source of uncorrelated returns – a necessary component of a diversified portfolio. Against public equities as defined by the S&P 500, systematic CTA returns have posted a correlation coefficient of -0.45 since 2001. This compares to -0.19 for discretionary CTAs and 0.67 for hedge funds as a whole. In fact, systematic CTA funds’ correlation to the hedge fund asset class is negative, unlike discretionary CTAs’. Systematic CTAs therefore play a crucial diversification role in LP portfolios.